Your dashboard
Access all your data to see what environmental factors you need to address.
Find out about your environment on the dashboard
The Learnometer Dashboard is where you will find all the data for your classroom environment. Access your status and history for the indicators and see if you are within the recommended ranges. If you already have a dashboard set up you can log in at https://learnometer.awair.cloud If you don’t have an account yet you can create one below.
The measurements
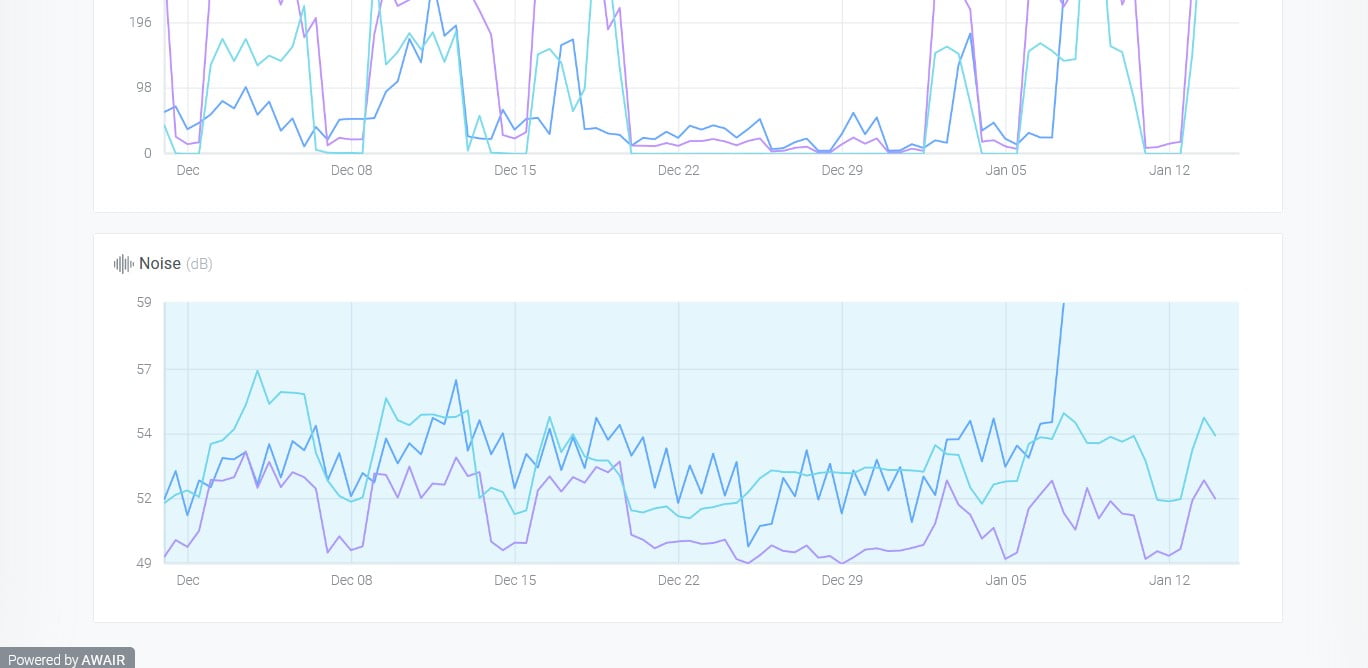
Your Learnometer Dashboard measures these seven conditions. Where you see a blue shaded area on the chart this represents Professor Heppell’s recommended range so you can see easily if you are within the recommended limits.
Carbon Dioxide
Chemicals (TVOCs)
Beyond the impact on wellbeing, research confirms that airborne pollution significantly damages learners academic progress.
Temperature
There is an optimal temperature range for learning. Outside that range performance suffers immediately.
Humidity
Similar concerns to temperature, but also bringing other health risks like toxic mould spores. Dehydration also damages cognitive performance.
Ambient Noise (dBA)
Noisy rooms obstruct children’s ability to concentrate and perform, wherever they are.
Fine Dust (PM2.5)
Micro-particulates can travel into children’s lungs, triggering health problems that also impact on attendance and performance.
Ambient Light (Lux)
Children learn less well when light levels are low, and behaviour also suffers. There is an equity issue too, when light levels are uneven across a room.